Saturday, 29 September 2012
Unit 3: The difference between the OFT & CC
Click here to access a prezi on the Office or Fair Trading and the Competition Commision.
Tuesday, 25 September 2012
Unit 4: The World Trade Organisation - A History
A few resources when looking at the role of the WTO.
The WTO recently released their revised estimates for the growth in world trade for 2012, 2.5% (revised down from 3.7%), and 2013, 4.5% (revised down from 5.6%). This link to their website can be used to discuss the role the WTO plays in international trade. There is also a short video which is an excellent introduction to the history and objectives of the WTO: (a more detailed history from Bretton Woods to GATT to WTO is available if you click here).
The WTO recently released their revised estimates for the growth in world trade for 2012, 2.5% (revised down from 3.7%), and 2013, 4.5% (revised down from 5.6%). This link to their website can be used to discuss the role the WTO plays in international trade. There is also a short video which is an excellent introduction to the history and objectives of the WTO: (a more detailed history from Bretton Woods to GATT to WTO is available if you click here).
Unit 3: Oligopoly Presentation
A useful presentation which introduces the key features of an Oligopolistic market structure. It also has some useful examples for you to discuss.
Questions for discussion:
Please use the earlier blog post to answer the questions on Jamie's Restaurant.
Questions for discussion:
Please use the earlier blog post to answer the questions on Jamie's Restaurant.
Monday, 24 September 2012
Unit 3: Profit Maximisation clip
A simple explanation as to why MC = MR is the profit maximising equilibrium..
Unit 3: Market Structures - Revision Presentation + Acivity
A useful presentation which puts all the market strucures together on one presentation. There is an activity for you to try after below this presentation...
Activity - Jamie's Kitchen
It is always tempting when looking at market structure to investigate the likes of Microsoft or the supermarkets but interesting cases can be found all around in relation to how firms behave and the complexities of analysing market structures.
We tend to assume that monopolies, for example, are large firms who dominate national and international markets - this can be the case but is not always so.
Jamie Oliver is a famous TV chef: he made his name from the BBC TV series 'The Naked Chef' and a book of the same title. A contract with retailer J Sainsbury followed a year later in 2000, which reportedly made him a millionaire. He then produced a programme for Channel 4, entitled 'Jamie's Kitchen', which focussed on training 15 unemployed youngsters in the catering business. The restaurant 'Fifteen' came out of that experiment.
Noted for his down-to-earth cockney persona and willingness to experiment and take risks with his food, as well as his passion for sourcing only the best ingredients, Oliver's restaurant was up there with the best in terms of the prices and reputation he garnered.
However, that reputation was called into question following the publication of a restaurant guide that was scathing in its criticism of Oliver's restaurant. The guide, Harden's, is written by those who visit the restaurants. Visitors to 'Fifteen' commented on the surly behaviour of staff, poor quality, uninspiring and expensive food and that the restaurant was devoid of atmosphere. The guide put 'Fifteen' at the bottom of 32 restaurants in its class - those being high priced restaurants. The average price of a meal at 'Fifteen' is around £70 per person.
'Fifteen' is a not for profit business and as such is a charity. Oliver's representatives have replied, commenting that the visitors' experiences were up to 18 months old and that measures had been taken to rectify the problems highlighted. The top chef in the guide was fellow TV star Gordon Ramsay. Ramsay's programmes have highlighted the commitment to the very highest standards in all aspects of the business and, so say his supporters, comes from having gained his experience as a working chef - something that Jamie Oliver had been accused of not possessing.
Tasks
You have the background to the story. Consider the following questions.
1.Which market structure best describes the restaurant industry in the UK?
2.Given your answer to question 1 above, explain what the short and long run equilibrium position for such a restaurant and the industry would be. Justify your view with reference to the industry and the market being considered.
3.In what ways might a restaurant such as 'Fifteen' differentiate its product/service?
4.To what extent would you suggest that a restaurant such as 'Fifteen' can exercise monopoly power?
5.On what basis could the market in which Oliver's restaurant is operating be termed an oligopoly?
6.In what ways could restaurants such as 'Fifteen' behave in a collusive manner and what might be the benefits and difficulties of engaging in such behaviour?
N.B. There is no suggestion or evidence whatsoever that 'Fifteen' or any other similar restaurant is engaging in such activity - this is a purely hypothetical question.
7.Evaluate the strategies that 'Fifteen' could adopt to regain its market position.
Some Hints:
To help you with your analysis, you may wish to consider the following points:
•When you are considering your answer, think about the characteristics of the market structure you think it might be in and try to identify how closely those characteristics match with the restaurant industry. Look at the Presentation to remind yourself of the characteristics.
•Question 2 is designed to assess your understanding of the diagrammatic representation of market structures. You would be expected to be able to understand the difference between a short-run position and a long-run one. It is advisable to ensure that you understand how to read graphs properly (many people think they can but when it comes to the analysis...) and that you understand the relationships between marginal and average data and the relationship between total, marginal and average data.
The latter also implies that some understanding is necessary of the price elasticity of demand for products. You can remind yourself of these relationships by looking at this supplementary Presentation on total and marginal values (search 'marginal values' on this blog).
•Question 3 should be relatively straightforward; there are clues in the text about this - think about location, ambience, character, price, quality, service, etc.
•Question 4 is seeking to assess your understanding of the subtleties involved when discussing monopoly power. Firms such as Microsoft may be big enough to wield monopoly power in fairly obvious ways - although they might claim that they are not, which is an interesting discussion in itself - but small firms can also exercise monopoly power. It may tend to be localised in nature. You will have to explain what the source of the monopoly power is and how it might exercise that power. If you have done this successfully then you will be able to explain what the consequences of such monopoly power might be. The key part of this question are the command words 'to what extent', which is requiring you to make a judgement. In this case, you are expected to judge whether 'Fifteen' is able to exercise strong monopoly power, some monopoly power in limited circumstances or hardly any at all. The answer will depend to a large extent on how you have classified the market structure. Remember to support your judgements with reference to the analysis you have made previously.
•Question 5 takes the issue above one stage further and suggests 'Fifteen' might be regarded as an oligopoly. In this case, it will be assuming that there are a small number of restaurants in the market who can exercise a degree of control over the industry - the industry in this case being high value, high quality, exclusive restaurants.
•Question 6 then takes the above discussion and gives you the opportunity of assessing how collusive behaviour could be organised - think of location, pricing, possibly what types of food they serve, and so on. When considering the costs and benefits the obvious point is to think of the impact on long-term profit levels but you are also asked to think about the problems associated with collusive behaviour - will everyone stick to the agreements, for example? There are plenty of textbooks that give a good explanation of collusive behaviour.
•The last question asks you to consider ways which 'Fifteen' could regain its position in the market - the text again gives some suggestion that they have already taken steps to this end. Think of the problems the guide highlighted and what steps the business could take to overcome these weaknesses. Avoid just saying bland things such as 'they can improve quality'. If you do think this is a way forward, explain how a restaurant can increase quality. This takes your answer to another level! The command word, again, is important. You must evaluate, so if you think quality is important, you must balance this against other measures you have identified to make a judgement as to whether quality is more or less important and why.
Activity - Jamie's Kitchen
It is always tempting when looking at market structure to investigate the likes of Microsoft or the supermarkets but interesting cases can be found all around in relation to how firms behave and the complexities of analysing market structures.
We tend to assume that monopolies, for example, are large firms who dominate national and international markets - this can be the case but is not always so.
Jamie Oliver is a famous TV chef: he made his name from the BBC TV series 'The Naked Chef' and a book of the same title. A contract with retailer J Sainsbury followed a year later in 2000, which reportedly made him a millionaire. He then produced a programme for Channel 4, entitled 'Jamie's Kitchen', which focussed on training 15 unemployed youngsters in the catering business. The restaurant 'Fifteen' came out of that experiment.
Noted for his down-to-earth cockney persona and willingness to experiment and take risks with his food, as well as his passion for sourcing only the best ingredients, Oliver's restaurant was up there with the best in terms of the prices and reputation he garnered.
However, that reputation was called into question following the publication of a restaurant guide that was scathing in its criticism of Oliver's restaurant. The guide, Harden's, is written by those who visit the restaurants. Visitors to 'Fifteen' commented on the surly behaviour of staff, poor quality, uninspiring and expensive food and that the restaurant was devoid of atmosphere. The guide put 'Fifteen' at the bottom of 32 restaurants in its class - those being high priced restaurants. The average price of a meal at 'Fifteen' is around £70 per person.
'Fifteen' is a not for profit business and as such is a charity. Oliver's representatives have replied, commenting that the visitors' experiences were up to 18 months old and that measures had been taken to rectify the problems highlighted. The top chef in the guide was fellow TV star Gordon Ramsay. Ramsay's programmes have highlighted the commitment to the very highest standards in all aspects of the business and, so say his supporters, comes from having gained his experience as a working chef - something that Jamie Oliver had been accused of not possessing.
Tasks
You have the background to the story. Consider the following questions.
1.Which market structure best describes the restaurant industry in the UK?
2.Given your answer to question 1 above, explain what the short and long run equilibrium position for such a restaurant and the industry would be. Justify your view with reference to the industry and the market being considered.
3.In what ways might a restaurant such as 'Fifteen' differentiate its product/service?
4.To what extent would you suggest that a restaurant such as 'Fifteen' can exercise monopoly power?
5.On what basis could the market in which Oliver's restaurant is operating be termed an oligopoly?
6.In what ways could restaurants such as 'Fifteen' behave in a collusive manner and what might be the benefits and difficulties of engaging in such behaviour?
N.B. There is no suggestion or evidence whatsoever that 'Fifteen' or any other similar restaurant is engaging in such activity - this is a purely hypothetical question.
7.Evaluate the strategies that 'Fifteen' could adopt to regain its market position.
Some Hints:
To help you with your analysis, you may wish to consider the following points:
 |
| What type of market structure would a particular restaurant be in? What factors would influence your answer? |
•You will need to think about the market in which the restaurant sits; is it in a market with all restaurants or is the fact that it has tried to differentiate itself mean that it is in a part of the overall market for eating out? If it is the former, then you would have to consider McDonald's, for example, as being a rival to 'Fifteen' - how appropriate is that?
•You might, therefore, conclude that the restaurant sits in a small market consisting of high-price, high-quality restaurants. If that is your conclusion, the market structure might be quite different and as such, the behaviour and the short and long run outcomes equally so.•When you are considering your answer, think about the characteristics of the market structure you think it might be in and try to identify how closely those characteristics match with the restaurant industry. Look at the Presentation to remind yourself of the characteristics.
•Question 2 is designed to assess your understanding of the diagrammatic representation of market structures. You would be expected to be able to understand the difference between a short-run position and a long-run one. It is advisable to ensure that you understand how to read graphs properly (many people think they can but when it comes to the analysis...) and that you understand the relationships between marginal and average data and the relationship between total, marginal and average data.
The latter also implies that some understanding is necessary of the price elasticity of demand for products. You can remind yourself of these relationships by looking at this supplementary Presentation on total and marginal values (search 'marginal values' on this blog).
 |
| How can restaurants differentiate the product and service they provide? |
•Question 3 should be relatively straightforward; there are clues in the text about this - think about location, ambience, character, price, quality, service, etc.
•Question 4 is seeking to assess your understanding of the subtleties involved when discussing monopoly power. Firms such as Microsoft may be big enough to wield monopoly power in fairly obvious ways - although they might claim that they are not, which is an interesting discussion in itself - but small firms can also exercise monopoly power. It may tend to be localised in nature. You will have to explain what the source of the monopoly power is and how it might exercise that power. If you have done this successfully then you will be able to explain what the consequences of such monopoly power might be. The key part of this question are the command words 'to what extent', which is requiring you to make a judgement. In this case, you are expected to judge whether 'Fifteen' is able to exercise strong monopoly power, some monopoly power in limited circumstances or hardly any at all. The answer will depend to a large extent on how you have classified the market structure. Remember to support your judgements with reference to the analysis you have made previously.
•Question 5 takes the issue above one stage further and suggests 'Fifteen' might be regarded as an oligopoly. In this case, it will be assuming that there are a small number of restaurants in the market who can exercise a degree of control over the industry - the industry in this case being high value, high quality, exclusive restaurants.
•Question 6 then takes the above discussion and gives you the opportunity of assessing how collusive behaviour could be organised - think of location, pricing, possibly what types of food they serve, and so on. When considering the costs and benefits the obvious point is to think of the impact on long-term profit levels but you are also asked to think about the problems associated with collusive behaviour - will everyone stick to the agreements, for example? There are plenty of textbooks that give a good explanation of collusive behaviour.
•The last question asks you to consider ways which 'Fifteen' could regain its position in the market - the text again gives some suggestion that they have already taken steps to this end. Think of the problems the guide highlighted and what steps the business could take to overcome these weaknesses. Avoid just saying bland things such as 'they can improve quality'. If you do think this is a way forward, explain how a restaurant can increase quality. This takes your answer to another level! The command word, again, is important. You must evaluate, so if you think quality is important, you must balance this against other measures you have identified to make a judgement as to whether quality is more or less important and why.
Unit 3: Total Vs Marginal values
A really useful revision presentation on costs and revenue relationships.....
Saturday, 22 September 2012
Unit 4: Economic Development Links
Thanks to Mo Tanweer for providing this really useful selection of economic development related links
Index of Wellbeing: Click here
Human Development Index (HDI): Click Here
2011: report of HDI – good to analyse trends, note incomplete data etc. Liberia and Chad interesting on short run vs long run development. Click Here
HDI vs Inequality-adjusted HDI: Click here
Gender Inequality Index: Click here
Yemen does poorly, but what’s amazing is how well Sweden does – indeed, how it continues to improve in the past few years. Almost perfect equality between genders!
Human Poverty Index – measure of deprivation. Important distinction between HPI-1 and HPI-2 - click here
Millenium Development Goals - Click here
Gender-related Development Index (GDI) and Gender Empowerment Measure (GEM) - Click here
Happy Planet Index: Click here
Bhutan: Click here
Coke - Click here
Unit 4: Economic Development - Chile

The Chilean economy is heavily dependent on copper exports, and a target of developed country status by 2018 looks ambitious. The Chilean government believes that it can be met a year early! But there will be many obstacles to overcome not least in meeting growing demand for reform in a country where income and wealth inequality has widened.
Thursday, 20 September 2012
Unit 4: A Comedy - European Debt Crisis
She's German. He's Greek. Can their ten year relationship survive the pressure?
This great short comedy from director Bob Denham is packed with references to the Euro debt crisis - see how many of the references you can get;
This great short comedy from director Bob Denham is packed with references to the Euro debt crisis - see how many of the references you can get;
Wednesday, 19 September 2012
Unit 4: Development: Constarints on growth.
This post will link to a series of articles on some of the possible constraints or limitations on the sustained growth and development of a country. Keep in mind a high level of diversity between countries and regions, some of these constraints have a bigger effect on potential growth and development in some countries than others.
Successful and effective policies are those that target and address the constraints. Some of these factors apply mainly to developed countries and some are focused on the growth potential of lower-income emerging economies many of whom have enjoyed rapid growth in recent years.
Remember that economic growth is a long-term concept referring in the main to a nation’s productive potential and competitiveness:
Infrastructure weaknesses
Primary Export Dependency
Ageing and/or declining population
Conflict and Corruption
Other issues include:
Human Capital Weaknesses
Savings Gap and Foreign Exchange Gap
Problems in making best use of natural capital resources
Inequalities of income and wealth
Poor Policy Making
Tuesday, 18 September 2012
Unit 4: Infrastructure & development
This is an excellent article which can help you understand the issues faced by even the best developing countries. A great foundation for unit 4 essays dealing with issues in development.
Infrastructure includes physical capital such as transport networks, energy, power and water supplies and telecommunications networks. Poor infrastructure hampers growth because it causes higher supply costs and delays for businesses. It reduces the mobility of labour and affects the ability of exporters to get their products to international markets.
A good example to use is India (click here for article) whose future growth is threatened by structural weaknesses in her infrastructure. Huge investment is needed in better roads, rail, bridges, and power and energy networks. Infrastructure is lacking too in agriculture.
Here are three examples of infrastructure deficiencies:
1. India: India’s irrigation system is deficient and not properly managed and this has made it very difficult to sustain food grain production when rainfall is less than expected – as was the case in 2012. This has led to a surge in food prices which hits the poorest communities hardest. For a few days in the summer of 2012, much of northern India was plunged into darkness for two consecutive days. About 700 million people were left without power, a situation that affected transport, communication, healthcare, industries and farming. India needs an estimated $400bn investment in the power sector if it is to meet its development goals.
2. Brazil: Host for the 2014 World Cup and the 2016 Olympics. Brazil’s growth is constrained by infrastructure weaknesses: In 2011, only 14% of her roads were paved. The World Economic Forum ranks Brazil’s quality of infrastructure 104th out of 142 countries surveyed, behind China (69th), India (86th) and Russia (100th).
3. Sub-Saharan Africa: The combined power generation capacity of the 48 countries of Sub-Saharan Africa is 68 gig watts – no more than Spain’s. Excluding South Africa, this figure falls to 28 GW, equivalent to the capacity of Argentina (except Argentina has a population of 40 million and Africa has 770 million.) A recent report from the Infrastructure Consortium of Africa (ICA), found that poor road, rail and harbour infrastructure adds 30-40% to the costs of goods traded among African countries. This chronic shortage of energy - with firms and people facing acute shortages of power – is a major barrier to growth and development.
Many countries will need to increase their spending on infrastructure in the years ahead to adapt to and deal with the consequences of climate change.
There has been much interest in recent years concerning the investment in infrastructure that businesses from emerging countries such as Brazil and China are making in the continent of Africa. China’s foreign direct investment in Africa has jumped from under $100 million in 2003 to more than $12 billion in 2011.
India's Energy Deficit
Y11 Economic Growth Reports to Mr Cameron
Y11 reports to David Cameron now uploaded onto the resources section of Fronter. Have a look to see what policies your classmates discussed and put forward to Mr Cameron.
Unit 4: Protectionism
As discussions of free trade and protectionism enter the presidential race in America, we have been using some of the following resources in the classroom.
As Barack Obama delivered a speech in Ohio reminding Americans of tyre tariffs imposed on China in 2009 which created over 1,000 jobs for Americans one was reminded of the infamous chicken tariff retaliation by China. The irony of the creation of 1,000 jobs gaining such a loud cheer after the Fed has announced that it will spend $40bn a month for an unspecified period of time in order to kick-start an economy where an estimated 12.5 million people are out of work may have been lost on this particular crowd.
The BBC today published an extensive piece on the state of tariffs in world trade today. It can be used to introduce the concept of protectionism in terms of tax breaks and favourable conditions for domestic firms as opposed to the textbook discussions of tariffs and quotas on imports into the country.
This interview with Pascal Lamy highlights some very interesting points too. One of the main things that students and teachers can learn from it is that despite an increase in protectionist measures in recent years there have been numerous tariff removal and trade agreements brokered in recent years.
Questions for discussion:
Do the advantages of free trade outweigh the disadvantages?
Are the points made in the first question the same for all countries?
All students - Wider Reading list
Click here to access the school Library's Sixth Form Wider Reading list. This has been built over the last 3 years and is designed to encourage Sixth Formers to read around their subjects giving them greater awareness and knowledge, and assist in their preparation for university.
Nearly all the books on the list are in the library and available to borrow. Essential preparation for examinations, university and beyond.
Nearly all the books on the list are in the library and available to borrow. Essential preparation for examinations, university and beyond.
Sunday, 16 September 2012
Unit 4: Primary Product Dependency
 |
| Copper mine in Kenya |
When prices fall, an economy will see a sharp reduction in export incomes, an adverse movement in their terms of trade, risks of a higher trade deficit and a danger that a nation will not be able to finance investment in education, healthcare and core infrastructure.
Here are some examples of export dependence for a selection of countries in Sub-Saharan Africa: The data shows the % of total exports in 2010:
1.Angola: 97% oil
2.Ghana: 39% gold, 26% oil, 17% cocoa
3.Kenya: 19% tea, 12% horticulture
4.Nigeria: 90% oil
5.Senegal: 11% fish, 11% phosphate
6.Tanzania: 37% gold
7.Uganda: 18% coffee
8.Zambia: 84% copper
Sub-Saharan Africa (SSA) is often cited as a region where primary sector dependence is very high. SSA’s share in global manufacturing trade remains extremely low.
Questions for discussion:
What are the advantages of focussing on one product?
What are the issues?
Is this the same for every primary product?
What has happened to the Terms of Trade over the last 20 years for SSA?
Wednesday, 12 September 2012
Opportunity Cost
Opportunity Cost is the BENEFIT forgone when choosing the next best alternative.
Opportunity Cost despite its name is about the benefits or the positive things that you may lose out on if you choose an alternative course of action.
In this video, the opportunity cost of getting a grade A in a test was a happy girlfriend. Both options are positives - the opportunity cost of a grade A is not an unhappy girlfriend. He has to give up a happy girlfriend to get an A in the test. This is why the definition of opportunity cost is the benefit forgone (given up).
Think of it as opportunity lost...
Unit 4; Economic Development
The Economic Development section of Unit 4 was answered relatively badly by the Y13's last year. As a result I am determined to improve the delivery of this by adding more resources for you to look at.
May I suggest that, although we won't be looking at this until after xmas, you read this now and digest the implications.
Developing Countries: Similarities & Differences
Of the 192 member states of the United Nations, only 52 are currently classified as high-income countries. In other words, 140 countries (73 per cent) are still considered developing economies.
The number of people living on less than US$1.25 a day is projected to be 883 million in 2015, compared with 1.4 billion in 2005 and 1.8 billion in 1990. However, much of this progress reflects rapid growth in China and India, while many African countries lag behind
World Bank Income Classification (2012)
As of 1 July 2012, the World Bank income classifications by GNI per capita are as follows:
1.Low income: $1,025 or less
2.Lower middle income: $1,026 to $4,035
3.Upper middle income: $4,036 to $12,475
4.High income: $12,476 or more
Diversity between developing countries
· No two less economically developed countries are the same!
· There is a huge amount of diversity between them
· Think about some of the key structural economic differences between nations – for example:
1.The size of an economy (i.e. population size, basic geography, annual level of national income)
2.Historical background including years since independence from colonial rule
3.Natural resource endowment
4.The age structure of the population
5.Ethnic and religious composition
6.Relative size / importance of public and private sectors of the economy
7.Structural of national output (e.g. primary, secondary, tertiary and quarternary sectors)
8.Structure of international trade (both geographical and the commodity pattern of trade)
9.Political stability, strength of democratic institutions, transparency of government
10.Ethnic and gender equality and tolerance
11.The ease with which new businesses can be created and sustained
12.Other competitiveness indicators including the relative size and strength of high-knowledge / high-technology industries
There are also some common characteristics of developing countries – the list below is not meant to be an exhaustive one, but here these characteristics might include:
1.Relatively low incomes per capita compared to richer advanced nations
2.Lower absolute levels of productivity (labour and capital)
3.A higher dependency on export incomes from primary commodities / low rates of export diversification
4.They have a large share of the population living in rural areas and employed in agriculture
5.A higher than normal “informal” sector of the economy for example in partial subsistence farming
6.Many industries in low-income developing countries tend to be some distance from the technological frontiers reached in rich advanced nations.
7.Relatively fast growth of population and a younger average age – giving a different shape to the population pyramid
8.Weaknesses in critical infrastructure such as telecommunications, transport, ports, water and sanitation and institutions such as stable government, a well functioning civil service and money and capital markets
Tuesday, 11 September 2012
Unit 1: Positive & Normative Statements

Positive Statements
A positive statement is a statement about what is and contains no indication of approval or disapproval. A positive statement can be wrong; it can be tested by objective use of evidence. The tools of positive economics are reason, logic and empiricism.
Normative Statements
A normative statement expresses a value judgment about whether a situation is desirable or undesirable.
"The British economy would be a lot stronger if Sarah Meeajan was Governor of the Bank of England"
is a normative statement because it expresses a judgment about what ought to be. Statements that include indicator words such as: should, ought, or prefer are likely to be normative rather than positive Decide whether the following statements are positive or normative:
Statement
Positive or Normative?
1 The government can reduce obesity by offering a subsidy to low income families when they buy fresh vegetables in the supermarket
2 Luxuries should be taxed more heavily than necessities
3 A rise in the value of the exchange rate will reduce the number of overseas tourists visiting London
4 The Minimum Wage needs to be replaced with a Living Wage of £8 per hour
5 Taxpayers should not have to pay for bail outs to a failing Greek economy
6 Drought in the United States should lead to a rise in the world price of grain
7 Reducing the top rate of income tax to 45% will increase relative poverty in Britain
8 It is right that the European Union has introduced a system of carbon trading as a way of cutting CO2 emissions
9 A reduction in the standard rate of VAT ought to bring about a recovery in consumer spending on many goods and services
10 A rise in the price of petrol will lead to an increase in the demand for rail transport
11 An increase in the rate of inflation will lead inevitably to an increase in unemployment
12 Unemployment is more harmful than inflation
13 The Government might target unemployment rather than inflation in order to achieve an improvement in economic growth
14 As a general rule, people are happier in more equal societies
15 Despite a large increase in income per head, people are no happier today than they were 50 years ago
16 The promotion of happiness is a more important goal than the maximisation of production
Sunday, 9 September 2012
Year 12 Challenge..
Hello!
This week your task is to learn/ refresh your memories on Production Possibility Frontiers!
You have two lessons to go over the theory in your groups. In the third lesson we will be having a quiz(!) to see which group has used their time and resources efficiently!
These are the points you need to go over..
- Definitions/purpose of PPF curves
- Using PPF curves to illustrate OPPORTUNITY COST NUMERICALLY!
- How to identify efficient and inefficient allocation of resources
- How to shift the PPF curve - 8 different ways researched in detail!
- What influences the shape of the PPF curve and why are some straight lines?
Here are some resources to help you out on your challenge..
Unit 4: What is Economics Development

Economist Michael Todaro specified three objectives of development:
Life sustaining goods and services: To increase the availability and widen the distribution of basic life-sustaining goods such as food, shelter, health and protection.
Higher incomes: To raise levels of living, including, in addition to higher incomes, the provision of more jobs, better education, and greater attention to cultural and human values, all of which will serve not only to enhance material well-being but also to generate greater individual and national self-esteem
Freedom to make economic and social choices: To expand the range of economic and social choices available to individuals and nations by freeing them from servitude and dependence not only in relation to other people and nation-states but also to the forces of ignorance and human misery.
Note the emphasis placed on ‘cultural and human values’, ‘self-esteem’ and freedom from ignorance; it is important to remember that development is about much more than advancing economic growth.
“Human development is the expansion of people’s freedom to live long, healthy and creative lives; to advance other goals they have reason to value; and to engage actively in shaping development equitably and sustainably on a shared planet. People are both the beneficiaries and the drivers of human development, as individuals and in groups”
Source: Human Development Report, November 2010
The most common measurement of development is the Human Development Index published each year by the United Nations Development Programme
Dudley Sears has defined development as “the reduction and elimination of poverty, inequality and unemployment within a growing economy”.
The Nobel Economist Amartya Sen writing in “Development as Freedom”, sees development as being concerned with improving the freedoms and capabilities of the disadvantaged, thereby enhancing the overall quality of life. Sen pursues the idea that development provides an opportunity to people to free themselves from the suffering caused by
o Early mortality
o Persecution
o Starvation
o Illiteracy
Development should be about increasing political freedom, cultural and social freedom and not just about raising incomes.
Millennium Development Goals (MDGs)
The Millennium Development Goals represent an ambitious set of development targets established in 2000 and designed to be met as fully as possible by the end of 2015.
1.Eradicate extreme poverty and hunger
2.Achieve universal primary education
3.Promote gender equality and empower women
4.Reduce child mortality
5.Improve maternal health
6.Combat HIV / AIDS, malaria and other diseases
7.Ensure environmental sustainability
8.Develop a global partnership for development
Next Steps
Follow the You Tube Channel of the United Nations Development Programme
Unit 2 & 4: Taxing the rich - does it work?
Wealth is spread far more unequally than income, so The Lib Dem leader and Coalition Deputy Prime Minister Nick Clegg has proposed a temporary wealth tax, and Ed Balls implied that Labour would introduce permanent tax on wealth. The graph from This week's Economist contrasts estimates of net private assets with net national debt. A wealth tax is being touted in Germany as a means to raise revenues.

This article on France's wealth tax was on the BBC's website this morning and might be used to consider Adam Smith's Canons of Taxation .
Equality -Tax payments should be proportional to income
Certainty- Tax liabilities should be clear and certain
Convenience of payment – Taxes should be collected at a time and in a manner convenient for taxpayer
Economy of collection- Taxes should not be expensive to collect and should not discourage business.
You can consider the costs of collection vs tax raised. Hardly predictable particularly in a French Presidential Election year, with arbitrary definitions of wealth. Of course the temptation to freeze tax bands to let fiscal drag haul more into the taxpayer's net is there.
In the 1970s, Harold Wilson's Labour Government proposed a Wealth Tax, civil servants considered that such a tax "Will lead people to seek non-resident status, result in a considerable outflow of funds in the form of dividends and interest." This was a warning of capital flight.
Treasury civil servants predicted that would result in an exodus of banks, insurance and shipping business moving out of the UK. Whilst Harold Lever, one of Labour's Cabinet Ministers observed that it would damange business confidence whilst the civil service implied that it would be ineffectual.
Will more civil servants be needed to collect a wealth tax? Is there a Renoir in the attic? How would the wealth valuations be carried out, by HMRC's staff or by the tax payers' self assesment of assets? Would there be an appeals system? Is there a danger that tax accountants would find ways to avoid a wealth tax, and is this really a good use of talented men and women?
Howard Glennerster, the author of the study observes that: "If any new move to tax wealth is to be successful it will only be so if the public,many of whom are now holders of modest wealth, are convinced that its unequal distribution is a problem."
If a wealth tax was introduced would it apply to pensions and savings? The list of exemptions listed by Bernard Jenkin suggests that a wealth tax might be incompatible with other economic goals.
Is there a risk of evasion, would people simply hide their jewellery, furniture and other assets? Is that a Renoir in your attic?
Conversely a wealth tax might create jobs for accountants and tax specialists, selling advice on how to avoid the tax. Does a wealth tax work? Jenkin estimated that 20,000 out of 20 million French households pay a wealth tax, the yield might be 0.04% of total wealth. Does it look as if it achieves a more equitable outcome?
Sweden abolished a wealth in 2011, the levy raised SKr4.5bn (£427m) from 2.5% of taxpayers, but was estimated to have driven SKr1,500bn (£142bn) out of the country. Yet the radical group Umfairteilen in Germany thinks that the wealth gap is widening, and that the wealth tax's time has come.
Denis Healy Labour's Chancellor of The Exchequer in the 1970s stated that Another lesson was that you should never commit yourself in Opposition to new taxes unless you have a very good idea how they will operate in practice. We had committed ourselves to a Wealth Tax: but in five years I found it impossible to draft one which would yield enough revenue to be worth the administrative cost and political hassle.‟
Questions:
Does a wealth tax create more problems than it solves, is there a case for trying to work out how existing taxes could raise more revenue.
Saturday, 8 September 2012
Unit 4: China's changing economy!

Tuesday, 4 September 2012
All economics students....
My Y13's are going to be doing this over the weekend. Can you get your smartphones or tablets out and find some time to explore your locality to shoot examples of economics in Dubai. Select six images and turn them into a Prezi or a PowerPoint and explain to the group why the images raise interesting economics questions.
Below are some examples from UK.
Can you think of some of the economic issues, concepts, ideas that might be associated with each?
I will be sending the best ones to tutor2u to share with others. There must be lots of budding student photographers out there who are taking their first steps as economists? They will showcase some of the best “economics on the street” photos taken in the next week - just upload them onto twitter and use the hash tag #econstreet - who knows, a brand new Tutor2u coffee mug might be on the way to you if selected
Over to you


Unit 3: Monopoly and prison!!

But what if it literally is a “captive market”?
If a fifteen minute phone call home cost you £11 then it is unlikely that you would call very often. In any case, there are other options to communicate such as mobile phone calls, texts, Skype or just simply visit in person. However, these other options are not available to prison inmates in the USA!
They have to pay what is being called “predatory” prison phone rates due to agreements between the phone companies and the state prisons. The phone companies bid to win the contract to be the exclusive provider of phone services to a prison and this often involves commission being paid for each phone call. This cost all gets passed along to the inmates and their families.
While you may have little sympathy for the inmates, an interesting class discussion could be had on the costs and benefits of allowing this high pricing. The article which can be found here , details some of the arguments and these could include
Benefits
- revenue raised helps to fund prison activities
- fits with the idea of punishing inmates for their crimes
- a disincentive for inmates to be organising crime from prison
Costs
- “a tax on the poorest people in our society” - the inmates families who end up having to pay are often very poor
- hinders rehabilitation / reintegration into society as well as relationships with family members (particularly children?)
Questions:
You may be able to think of some other factors and you can then lead that into a discussion of evaluation - which is the most important factor (and therefore do you support the high prices or not)?
Monday, 3 September 2012
Unit 3: Cost Curves lesson plan
Cost curves are probably the worst concept to begin the year. However, it is essential you have a hold of the theory as it is required for several multiple choice questions.
Introducing the exercise:
The starting point for the exercise is to draw a total variable cost curve (VC). We explain that students
should simply assume that its shape is correct for the moment, but the VC curve will be derived at the end of
the exercise. We have shown a VC curve in Figure I to make this reading easier to follow. You could also
add that if students accept short-run (a good time to review the concept) VC as drawn, all the other cost
curves and their shapes follow logically given their definitions and the rules of geometry.
The cost relationships:
Teachers might like to begin by reviewing the definitions of the various cost concepts, but the important
point is that the class is aware of the following relationships. We have set these out using the familiar
symbols for brevity. Note that some texts use VC, while others may use TVC for total variable cost, etc.
TC = VC + FC
This is all that is needed for the total relationships and now you could continue to revise by adding FC to
Figure I and deriving TC as the line obtained by shifting the VC curve upwards by the amount of FC. The
average and marginal relationships (where A stands for average and M for marginal) for this review exercise
are:

Figure I
For this last relationship, since TC is parallel above VC, the slopes of both curves are the same at each level
of output.
Two simple rules:
These are:
a) If we take a point on a total curve (in this case associated with a quantity of output) and connect it to
the origin with a straight line, the slope of the line measures average.
b) If we draw a tangent to a total curve (at some quantity) the slope of the tangent measures marginal. In the first instance, if VC is 800 at an output of 100, AVC is 8. This would be the gradient of the straight line connected to the origin. In the second instance, the tangent to the total curve measures the incremental
change in variable cost associated with a small change in output.
The rules and the shape of the curves:
We illustrate briefly with the VC curve in Figure I, above. A good long straight edge and a ruler are useful in
class and can save you drawing a lot of lines. Starting with the second rule, you can show that MC declines
initially because the slopes of successive tangents to VC decrease as more output is produced. This continues until an output corresponding to point A on your VC is reached. This is minimum MC (we don’t know if you mention points of inflection) and MC then increases beyond this output.
For the second rule, the slope of successive straight lines connecting points on the VC curve to the origin will decrease until an output corresponding to point B is reached. This is minimum AVC, and the continued
application of this rule shows that AVC increases beyond this output. You might want to take some time
explaining the significance of point B. Here the two rules coincide (figuratively speaking) in that the slope of
the tangent to the curve is equal to the slope of a straight line connecting B to the origin of the diagram.
Hence MC is equal to AVC and can be shown to cut AVC at its minimum point. This is a good time to
sketch the AVC and MC curves and locate points like A and B.
From here, if you have added FC and TC to your original graph, it is a simple matter to use the first rule to
show that AFC continues to decline as more output is produced and then to repeat the process you used on
VC with your TC curve. Again it is worth spending time with the point (i.e. where the two rules coincide) on
TC that corresponds to B on your VC. We again have MC cutting ATC (in this instance) at its minimum
point, but this occurs at a higher output level than at point B. You could now add ATC and AFC to AVC and MC in your other illustration.
Explaining the original shape of VC:
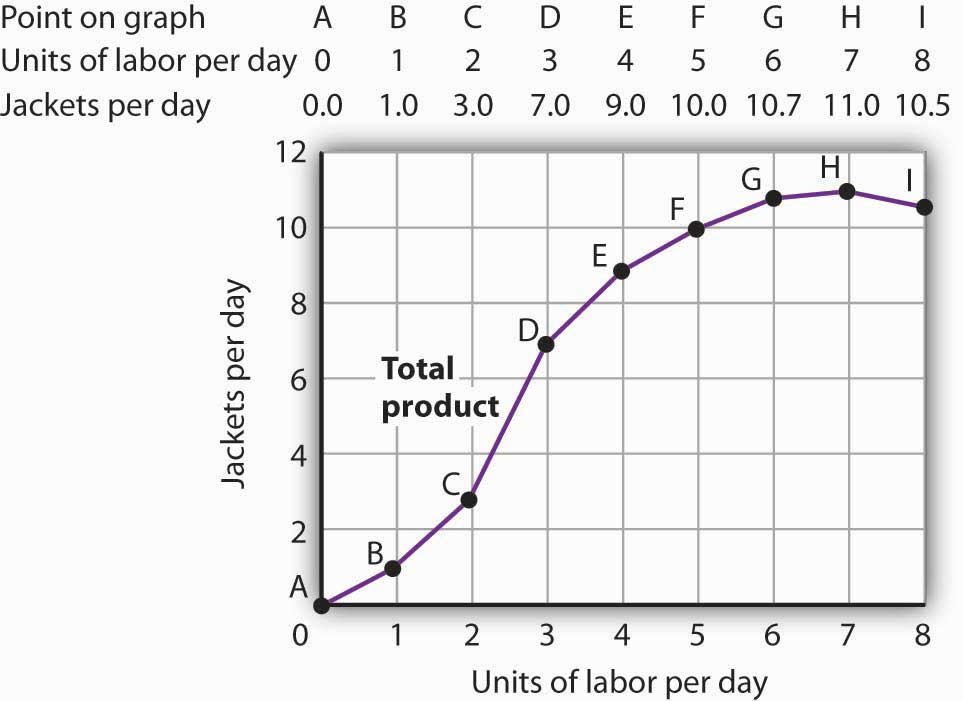
The last step is to show graphically that the shape of the variable cost curve comes from the law of diminishing returns as it relates to the total product curve. You have probably already given an example to
show that as successive units of a variable factor are added to the production process, total product first
increases at an increasing rate and then the law of diminishing returns sets in. The object here is to draw a
total product (TP) curve and then relate it to the total variable cost curve. The TP in Figure II shows
increasing and diminishing marginal returns. You might now ask the students, given labour (L) as the only
variable factor (an historical short-run assumption), what are the components of VC? Students will realize
that it is the wage rate (w) times the number of workers (the variable factor, L) employed.
Viewing Figures I and II, we have three variables; Q, VC and L. Q is present in both Figures and if VC can
be reconciled with L, the curves can be compared. We can do this remembering the VC = (L x w) and then
assuming that w is equal to one.
Given the assumption that the wage rate equals $1 per time period (to dispense with scaling problems), we
then rotate Figure II counterclockwise to line up against Figure I in the northwest quadrant. This is illustrated
in Figure III, and it is easy for students to see the relationship between the VC curve and the TP curve. If you really want to go into detail, you could use an example for the law of diminishing returns and relate it to the points of inflection in your two curves.
 Comment:
One of the advantages of this summary exercise is that there are many ways that it can be run (depending on
the size and ability of your class). The writer has predominantly used the lecture mode, but has also used
other methods in tutorials. You could get class members up to the board, let them work in groups to see what they come up with after you have explained the rules, etc., etc. We would welcome further suggestions and ideas in this regard.
c) Exercises
i) Probably the best type of exercise to cement the cost relationships is to get students to work through a tabular exercise. Here is a starter, and it is easy to add rows - incorporating your own tricks.
ii) In terms of the visual relationships, you could get students to reverse the axes of the TP curve to see what
shape they get; show how a scale change in the northwest quadrant of Figure II need not affect the shape of
the graph; and/or draw one of the curves on paper and reverse it (hold it up to the light?) to work on the
mirror image concept.
iii) We know from our sessions with secondary school teachers at Massey, that some of you get your
students involved with businesses in the local community. You might get groups to do surveys on the cost
structures of businesses directly engaged in production. Also are the businesses multiproduct firms? What
are the products? One issue to concentrate on would be what management views as fixed and variable costs
and the timeframe in which they feel that all costs become variable. The purpose of this exercise is to give
your students a feel for how economic theory stacks up to actual experience.
d) Conclusion
A good concluding point is to emphasize that one reason economists make the short-run distinction between
fixed and variable inputs is that this is about the simplest production function that we can come up with. It
illustrates “ceteris paribus”, the effect of a change in something when other things are held constant. Most
economists would also argue that it is still useful for making predictions when used in the theory of the firm.
As some of your students move on in economics, they will be exposed to more complex production
situations that are more realistic.
Lastly, you might mention the importance of understanding the average and marginal cost relationships since
they are crucial to an understanding of the theory of the firm. An explanation of competition, monopoly and
imperfect competition simply requires the same cost curves that we derived above, then the specific demand
characteristics of each firm type are graphed on to them and the profit maximizing rule is applied. In other
words, never forget the shapes (especially) of the ATC, AVC and MC curves.
Figure I and deriving TC as the line obtained by shifting the VC curve upwards by the amount of FC. The
average and marginal relationships (where A stands for average and M for marginal) for this review exercise
are:
ATC = TC / Q
= VC / Q + FC / Q
= AVC + AFC
MC = DTC / DQ = DVC / DQ
Figure I
For this last relationship, since TC is parallel above VC, the slopes of both curves are the same at each level
of output.
Two simple rules:
These are:
a) If we take a point on a total curve (in this case associated with a quantity of output) and connect it to
the origin with a straight line, the slope of the line measures average.
b) If we draw a tangent to a total curve (at some quantity) the slope of the tangent measures marginal. In the first instance, if VC is 800 at an output of 100, AVC is 8. This would be the gradient of the straight line connected to the origin. In the second instance, the tangent to the total curve measures the incremental
change in variable cost associated with a small change in output.
The rules and the shape of the curves:
We illustrate briefly with the VC curve in Figure I, above. A good long straight edge and a ruler are useful in
class and can save you drawing a lot of lines. Starting with the second rule, you can show that MC declines
initially because the slopes of successive tangents to VC decrease as more output is produced. This continues until an output corresponding to point A on your VC is reached. This is minimum MC (we don’t know if you mention points of inflection) and MC then increases beyond this output.
For the second rule, the slope of successive straight lines connecting points on the VC curve to the origin will decrease until an output corresponding to point B is reached. This is minimum AVC, and the continued
application of this rule shows that AVC increases beyond this output. You might want to take some time
explaining the significance of point B. Here the two rules coincide (figuratively speaking) in that the slope of
the tangent to the curve is equal to the slope of a straight line connecting B to the origin of the diagram.
Hence MC is equal to AVC and can be shown to cut AVC at its minimum point. This is a good time to
sketch the AVC and MC curves and locate points like A and B.
From here, if you have added FC and TC to your original graph, it is a simple matter to use the first rule to
show that AFC continues to decline as more output is produced and then to repeat the process you used on
VC with your TC curve. Again it is worth spending time with the point (i.e. where the two rules coincide) on
TC that corresponds to B on your VC. We again have MC cutting ATC (in this instance) at its minimum
point, but this occurs at a higher output level than at point B. You could now add ATC and AFC to AVC and MC in your other illustration.
Explaining the original shape of VC:
The last step is to show graphically that the shape of the variable cost curve comes from the law of diminishing returns as it relates to the total product curve. You have probably already given an example to
show that as successive units of a variable factor are added to the production process, total product first
increases at an increasing rate and then the law of diminishing returns sets in. The object here is to draw a
total product (TP) curve and then relate it to the total variable cost curve. The TP in Figure II shows
increasing and diminishing marginal returns. You might now ask the students, given labour (L) as the only
variable factor (an historical short-run assumption), what are the components of VC? Students will realize
that it is the wage rate (w) times the number of workers (the variable factor, L) employed.
Viewing Figures I and II, we have three variables; Q, VC and L. Q is present in both Figures and if VC can
be reconciled with L, the curves can be compared. We can do this remembering the VC = (L x w) and then
assuming that w is equal to one.
Given the assumption that the wage rate equals $1 per time period (to dispense with scaling problems), we
then rotate Figure II counterclockwise to line up against Figure I in the northwest quadrant. This is illustrated
in Figure III, and it is easy for students to see the relationship between the VC curve and the TP curve. If you really want to go into detail, you could use an example for the law of diminishing returns and relate it to the points of inflection in your two curves.
Figure II
One of the advantages of this summary exercise is that there are many ways that it can be run (depending on
the size and ability of your class). The writer has predominantly used the lecture mode, but has also used
other methods in tutorials. You could get class members up to the board, let them work in groups to see what they come up with after you have explained the rules, etc., etc. We would welcome further suggestions and ideas in this regard.
c) Exercises
i) Probably the best type of exercise to cement the cost relationships is to get students to work through a tabular exercise. Here is a starter, and it is easy to add rows - incorporating your own tricks.
ii) In terms of the visual relationships, you could get students to reverse the axes of the TP curve to see what
shape they get; show how a scale change in the northwest quadrant of Figure II need not affect the shape of
the graph; and/or draw one of the curves on paper and reverse it (hold it up to the light?) to work on the
mirror image concept.
iii) We know from our sessions with secondary school teachers at Massey, that some of you get your
students involved with businesses in the local community. You might get groups to do surveys on the cost
structures of businesses directly engaged in production. Also are the businesses multiproduct firms? What
are the products? One issue to concentrate on would be what management views as fixed and variable costs
and the timeframe in which they feel that all costs become variable. The purpose of this exercise is to give
your students a feel for how economic theory stacks up to actual experience.
d) Conclusion
A good concluding point is to emphasize that one reason economists make the short-run distinction between
fixed and variable inputs is that this is about the simplest production function that we can come up with. It
illustrates “ceteris paribus”, the effect of a change in something when other things are held constant. Most
economists would also argue that it is still useful for making predictions when used in the theory of the firm.
As some of your students move on in economics, they will be exposed to more complex production
situations that are more realistic.
Lastly, you might mention the importance of understanding the average and marginal cost relationships since
they are crucial to an understanding of the theory of the firm. An explanation of competition, monopoly and
imperfect competition simply requires the same cost curves that we derived above, then the specific demand
characteristics of each firm type are graphed on to them and the profit maximizing rule is applied. In other
words, never forget the shapes (especially) of the ATC, AVC and MC curves.
Saturday, 1 September 2012
Unit 4: Comparative advantage & Bangladesh

This, at first glance seems strange, as China is renowned for being a low cost centre for manufacturers. Times change! Whilst China once had a massive comparative advantage in unit labour costs this has recently begun to be eroded as wages and other costs have risen.
This has led to a boom for Bangladeshi clothing manufacturers who are now exporting to China. Bangladesh enjoys even lower unit labour than China, which obviously means that it is cheaper to produce there then in China.
The response of the Chinese Government will be interesting. These exports are currently enjoying duty free access to China. Will Beijing allow that to continue if China starts exporting jobs as well as everything else and start protecting their domestic producers? Or, will they view it as an inevitable consequence of a move up the value chain?
That Chinese workers are no longer the low skilled/low wage employees of a few years ago, and therefore this is something to be embraced?
Will this boom last for Bangladesh? Their infra-structure could be described as creaky, at best. There is pressure on Western companies not buy from manufacturers that pay low, low wages and industrial conflict is on the rise as Bangladeshi workers push for better pay and conditions. Are ever lower costs the best way to build a sustainable comparative advantage, or are low pay low skill jobs better than the alternatives for the time being at least?
Questions:
What do you know about the concept of comparative advantage?
Does the UK have comparative advantage in any goods or services? (If so, how?)
Subscribe to:
Posts (Atom)