Total Pageviews

Sunday, 9 September 2012

Unit 4: What is Economics Development

Economic development is a broad term that does not have a single, unique definition. In this introductory study note we look at some interpretations of the meaning of economic development. There is also a list of the economics development goal;s...essential for any Unit 4 question on development!


Economist Michael Todaro specified three objectives of development:


Life sustaining goods and services: To increase the availability and widen the distribution of basic life-sustaining goods such as food, shelter, health and protection.

Higher incomes: To raise levels of living, including, in addition to higher incomes, the provision of more jobs, better education, and greater attention to cultural and human values, all of which will serve not only to enhance material well-being but also to generate greater individual and national self-esteem

Freedom to make economic and social choices: To expand the range of economic and social choices available to individuals and nations by freeing them from servitude and dependence not only in relation to other people and nation-states but also to the forces of ignorance and human misery.

Note the emphasis placed on ‘cultural and human values’, ‘self-esteem’ and freedom from ignorance; it is important to remember that development is about much more than advancing economic growth.

“Human development is the expansion of people’s freedom to live long, healthy and creative lives; to advance other goals they have reason to value; and to engage actively in shaping development equitably and sustainably on a shared planet. People are both the beneficiaries and the drivers of human development, as individuals and in groups”

Source: Human Development Report, November 2010

The most common measurement of development is the Human Development Index published each year by the United Nations Development Programme

Dudley Sears has defined development as “the reduction and elimination of poverty, inequality and unemployment within a growing economy”.

The Nobel Economist Amartya Sen writing in “Development as Freedom”, sees development as being concerned with improving the freedoms and capabilities of the disadvantaged, thereby enhancing the overall quality of life. Sen pursues the idea that development provides an opportunity to people to free themselves from the suffering caused by

o Early mortality
o Persecution
o Starvation
o Illiteracy

Development should be about increasing political freedom, cultural and social freedom and not just about raising incomes.

Millennium Development Goals (MDGs)

The Millennium Development Goals represent an ambitious set of development targets established in 2000 and designed to be met as fully as possible by the end of 2015.
1.Eradicate extreme poverty and hunger
2.Achieve universal primary education
3.Promote gender equality and empower women
4.Reduce child mortality
5.Improve maternal health
6.Combat HIV / AIDS, malaria and other diseases
7.Ensure environmental sustainability
8.Develop a global partnership for development

Next Steps

Follow the You Tube Channel of the United Nations Development Programme


Unit 2 & 4: Taxing the rich - does it work?

Wealth is spread far more unequally than income, so The Lib Dem leader and Coalition Deputy Prime Minister Nick Clegg has proposed a temporary wealth tax, and Ed Balls implied that Labour would introduce permanent tax on wealth. The graph from This week's Economist contrasts estimates of net private assets with net national debt. A wealth tax is being touted in Germany as a means to raise revenues.


This article on France's wealth tax was on the BBC's website this morning and might be used to consider Adam Smith's Canons of Taxation .


Equality -Tax payments should be proportional to income

Certainty- Tax liabilities should be clear and certain

Convenience of payment – Taxes should be collected at a time and in a manner convenient for taxpayer

Economy of collection- Taxes should not be expensive to collect and should not discourage business.

You can consider the costs of collection vs tax raised. Hardly predictable particularly in a French Presidential Election year, with arbitrary definitions of wealth. Of course the temptation to freeze tax bands to let fiscal drag haul more into the taxpayer's net is there.

In the 1970s, Harold Wilson's Labour Government proposed a Wealth Tax, civil servants considered that such a tax "Will lead people to seek non-resident status, result in a considerable outflow of funds in the form of dividends and interest." This was a warning of capital flight.

Treasury civil servants predicted that would result in an exodus of banks, insurance and shipping business moving out of the UK. Whilst Harold Lever, one of Labour's Cabinet Ministers observed that it would damange business confidence whilst the civil service implied that it would be ineffectual.

Will more civil servants be needed to collect a wealth tax? Is there a Renoir in the attic? How would the wealth valuations be carried out, by HMRC's staff or by the tax payers' self assesment of assets? Would there be an appeals system? Is there a danger that tax accountants would find ways to avoid a wealth tax, and is this really a good use of talented men and women?

Howard Glennerster, the author of the study observes that: "If any new move to tax wealth is to be successful it will only be so if the public,many of whom are now holders of modest wealth, are convinced that its unequal distribution is a problem."

If a wealth tax was introduced would it apply to pensions and savings? The list of exemptions listed by Bernard Jenkin suggests that a wealth tax might be incompatible with other economic goals.

Is there a risk of evasion, would people simply hide their jewellery, furniture and other assets? Is that a Renoir in your attic?

Conversely a wealth tax might create jobs for accountants and tax specialists, selling advice on how to avoid the tax. Does a wealth tax work? Jenkin estimated that 20,000 out of 20 million French households pay a wealth tax, the yield might be 0.04% of total wealth. Does it look as if it achieves a more equitable outcome?

Sweden abolished a wealth in 2011, the levy raised SKr4.5bn (£427m) from 2.5% of taxpayers, but was estimated to have driven SKr1,500bn (£142bn) out of the country. Yet the radical group Umfairteilen in Germany thinks that the wealth gap is widening, and that the wealth tax's time has come.

Denis Healy Labour's Chancellor of The Exchequer in the 1970s stated that Another lesson was that you should never commit yourself in Opposition to new taxes unless you have a very good idea how they will operate in practice. We had committed ourselves to a Wealth Tax: but in five years I found it impossible to draft one which would yield enough revenue to be worth the administrative cost and political hassle.‟

Questions:

Does a wealth tax create more problems than it solves, is there a case for trying to work out how existing taxes could raise more revenue.


Saturday, 8 September 2012

Unit 4: China's changing economy!

Click here to access an article showing how China's economy has changed over the years. Very useful foir the Economic Development section of the syllabus.

Tuesday, 4 September 2012

All economics students....

My Y13's are going to be doing this over the weekend. Can you get your smartphones or tablets out and find some time to explore your locality to shoot examples of economics in Dubai. Select six images and turn them into a Prezi or a PowerPoint and explain to the group why the images raise interesting economics questions.


Below are some examples from UK.
Can you think of some of the economic issues, concepts, ideas that might be associated with each?

I will be sending the best ones to tutor2u to share with others. There must be lots of budding student photographers out there who are taking their first steps as economists? They will showcase some of the best “economics on the street” photos taken in the next week - just upload them onto twitter and use the hash tag #econstreet - who knows, a brand new Tutor2u coffee mug might be on the way to you if selected

Over to you


Unit 3: Monopoly and prison!!

Economic theory tells us that in most circumstances, monopoly power will lead to higher prices for consumers. Sometimes governments may intervene, especially in the case where there is genuinely no competition and the good or service is perceived as important.

But what if it literally is a “captive market”?


If a fifteen minute phone call home cost you £11 then it is unlikely that you would call very often. In any case, there are other options to communicate such as mobile phone calls, texts, Skype or just simply visit in person. However, these other options are not available to prison inmates in the USA!

They have to pay what is being called “predatory” prison phone rates due to agreements between the phone companies and the state prisons. The phone companies bid to win the contract to be the exclusive provider of phone services to a prison and this often involves commission being paid for each phone call. This cost all gets passed along to the inmates and their families.

While you may have little sympathy for the inmates, an interesting class discussion could be had on the costs and benefits of allowing this high pricing. The article which can be found here , details some of the arguments and these could include

Benefits

- revenue raised helps to fund prison activities

- fits with the idea of punishing inmates for their crimes

- a disincentive for inmates to be organising crime from prison

Costs

- “a tax on the poorest people in our society” - the inmates families who end up having to pay are often very poor

- hinders rehabilitation / reintegration into society as well as relationships with family members (particularly children?)

Questions:

You may be able to think of some other factors and you can then lead that into a discussion of evaluation - which is the most important factor (and therefore do you support the high prices or not)?


Monday, 3 September 2012

Unit 3: Cost Curves lesson plan

Cost curves are probably the worst concept to begin the year. However, it is essential you have a hold of the theory as it is required for several multiple choice questions.

Introducing the exercise:


The starting point for the exercise is to draw a total variable cost curve (VC). We explain that students
should simply assume that its shape is correct for the moment, but the VC curve will be derived at the end of
the exercise. We have shown a VC curve in Figure I to make this reading easier to follow. You could also
add that if students accept short-run (a good time to review the concept) VC as drawn, all the other cost
curves and their shapes follow logically given their definitions and the rules of geometry.

The cost relationships:

Teachers might like to begin by reviewing the definitions of the various cost concepts, but the important
point is that the class is aware of the following relationships. We have set these out using the familiar
symbols for brevity. Note that some texts use VC, while others may use TVC for total variable cost, etc.

TC = VC + FC   This is all that is needed for the total relationships and now you could continue to revise by adding FC to
Figure I and deriving TC as the line obtained by shifting the VC curve upwards by the amount of FC. The
average and marginal relationships (where A stands for average and M for marginal) for this review exercise
are:

ATC = TC / Q

= VC / Q + FC / Q

= AVC + AFC

MC = DTC / DQ = DVC / DQ


Figure I

For this last relationship, since TC is parallel above VC, the slopes of both curves are the same at each level
of output.

Two simple rules:

These are:

a) If we take a point on a total curve (in this case associated with a quantity of output) and connect it to
the origin with a straight line, the slope of the line measures average.

b) If we draw a tangent to a total curve (at some quantity) the slope of the tangent measures marginal. In the first instance, if VC is 800 at an output of 100, AVC is 8. This would be the gradient of the straight line connected to the origin. In the second instance, the tangent to the total curve measures the incremental
change in variable cost associated with a small change in output.

The rules and the shape of the curves:

We illustrate briefly with the VC curve in Figure I, above. A good long straight edge and a ruler are useful in
class and can save you drawing a lot of lines. Starting with the second rule, you can show that MC declines
initially because the slopes of successive tangents to VC decrease as more output is produced. This continues until an output corresponding to point A on your VC is reached. This is minimum MC (we don’t know if you mention points of inflection) and MC then increases beyond this output.

For the second rule, the slope of successive straight lines connecting points on the VC curve to the origin will decrease until an output corresponding to point B is reached. This is minimum AVC, and the continued
application of this rule shows that AVC increases beyond this output. You might want to take some time
explaining the significance of point B. Here the two rules coincide (figuratively speaking) in that the slope of
the tangent to the curve is equal to the slope of a straight line connecting B to the origin of the diagram.

Hence MC is equal to AVC and can be shown to cut AVC at its minimum point. This is a good time to
sketch the AVC and MC curves and locate points like A and B.

From here, if you have added FC and TC to your original graph, it is a simple matter to use the first rule to
show that AFC continues to decline as more output is produced and then to repeat the process you used on
VC with your TC curve. Again it is worth spending time with the point (i.e. where the two rules coincide) on
TC that corresponds to B on your VC. We again have MC cutting ATC (in this instance) at its minimum
point, but this occurs at a higher output level than at point B. You could now add ATC and AFC to AVC and MC in your other illustration.

Explaining the original shape of VC:

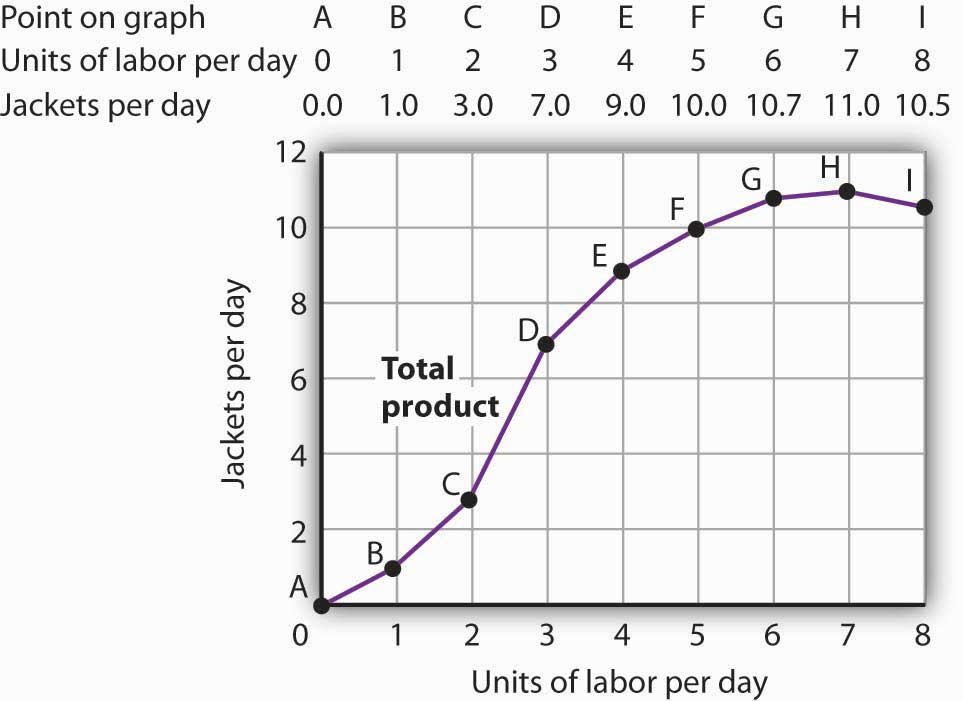
The last step is to show graphically that the shape of the variable cost curve comes from the law of diminishing returns as it relates to the total product curve. You have probably already given an example to
show that as successive units of a variable factor are added to the production process, total product first
increases at an increasing rate and then the law of diminishing returns sets in. The object here is to draw a
total product (TP) curve and then relate it to the total variable cost curve. The TP in Figure II shows
increasing and diminishing marginal returns. You might now ask the students, given labour (L) as the only
variable factor (an historical short-run assumption), what are the components of VC? Students will realize
that it is the wage rate (w) times the number of workers (the variable factor, L) employed.

Viewing Figures I and II, we have three variables; Q, VC and L. Q is present in both Figures and if VC can
be reconciled with L, the curves can be compared. We can do this remembering the VC = (L x w) and then
assuming that w is equal to one.

Given the assumption that the wage rate equals $1 per time period (to dispense with scaling problems), we
then rotate Figure II counterclockwise to line up against Figure I in the northwest quadrant. This is illustrated
in Figure III, and it is easy for students to see the relationship between the VC curve and the TP curve. If you really want to go into detail, you could use an example for the law of diminishing returns and relate it to the points of inflection in your two curves.

Figure II

Comment:

One of the advantages of this summary exercise is that there are many ways that it can be run (depending on
the size and ability of your class). The writer has predominantly used the lecture mode, but has also used
other methods in tutorials. You could get class members up to the board, let them work in groups to see what they come up with after you have explained the rules, etc., etc. We would welcome further suggestions and ideas in this regard.

c) Exercises

i) Probably the best type of exercise to cement the cost relationships is to get students to work through a tabular exercise. Here is a starter, and it is easy to add rows - incorporating your own tricks.

ii) In terms of the visual relationships, you could get students to reverse the axes of the TP curve to see what
shape they get; show how a scale change in the northwest quadrant of Figure II need not affect the shape of
the graph; and/or draw one of the curves on paper and reverse it (hold it up to the light?) to work on the
mirror image concept.

iii) We know from our sessions with secondary school teachers at Massey, that some of you get your
students involved with businesses in the local community. You might get groups to do surveys on the cost
structures of businesses directly engaged in production. Also are the businesses multiproduct firms? What
are the products? One issue to concentrate on would be what management views as fixed and variable costs
and the timeframe in which they feel that all costs become variable. The purpose of this exercise is to give
your students a feel for how economic theory stacks up to actual experience.
d) Conclusion

A good concluding point is to emphasize that one reason economists make the short-run distinction between
fixed and variable inputs is that this is about the simplest production function that we can come up with. It
illustrates “ceteris paribus”, the effect of a change in something when other things are held constant. Most
economists would also argue that it is still useful for making predictions when used in the theory of the firm.

As some of your students move on in economics, they will be exposed to more complex production
situations that are more realistic.

Lastly, you might mention the importance of understanding the average and marginal cost relationships since
they are crucial to an understanding of the theory of the firm. An explanation of competition, monopoly and
imperfect competition simply requires the same cost curves that we derived above, then the specific demand
characteristics of each firm type are graphed on to them and the profit maximizing rule is applied. In other
words, never forget the shapes (especially) of the ATC, AVC and MC curves.

Saturday, 1 September 2012

Unit 4: Comparative advantage & Bangladesh

Bangladesh is starting to grow its exports of clothing to China according to this BBC article.

This, at first glance seems strange, as China is renowned for being a low cost centre for manufacturers. Times change! Whilst China once had a massive comparative advantage in unit labour costs this has recently begun to be eroded as wages and other costs have risen.

This has led to a boom for Bangladeshi clothing manufacturers who are now exporting to China. Bangladesh enjoys even lower unit labour than China, which obviously means that it is cheaper to produce there then in China.

The response of the Chinese Government will be interesting. These exports are currently enjoying duty free access to China. Will Beijing allow that to continue if China starts exporting jobs as well as everything else and start protecting their domestic producers? Or, will they view it as an inevitable consequence of a move up the value chain?

That Chinese workers are no longer the low skilled/low wage employees of a few years ago, and therefore this is something to be embraced?

Will this boom last for Bangladesh? Their infra-structure could be described as creaky, at best. There is pressure on Western companies not buy from manufacturers that pay low, low wages and industrial conflict is on the rise as Bangladeshi workers push for better pay and conditions. Are ever lower costs the best way to build a sustainable comparative advantage, or are low pay low skill jobs better than the alternatives for the time being at least?

Questions:

What do you know about the concept of comparative advantage?
Does the UK have comparative advantage in any goods or services? (If so, how?)