The output gap is the difference between the actual level of output and the potential level of output.
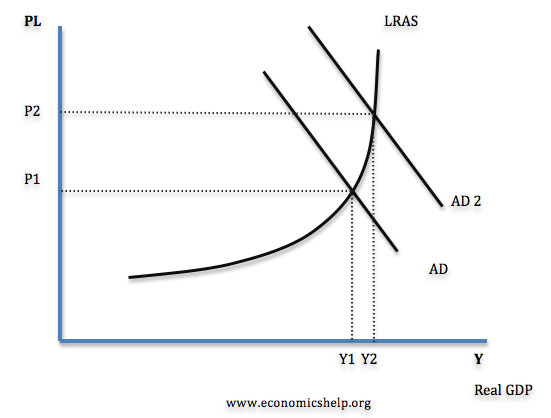
If you look at the above graph, the potential level of output is Y2. We know that this is full capacity as at Y2 the LRAS is inelastic indicating no spare resources.
In the above graph the actual level of output is Y1; We have a negative output gap! The output gap is the difference between potential and actual output (Y2-Y1)
What are the consequences of an output gap?
Well, firstly there is downward pressure on the price level as indicated by the fall from P2 to P1. This could potentially be a good thing as it could improve international competitiveness.
The second most obvious impact is a fall in employment as illustrated by the move from Y1 - Y2. More unemployment means that there is excess supply in the labour market and as a result workers have less bargaining power when it comes to wages and therefore have to accept lower wages.
A fall in output from Y1 - Y2 also means that other factors of production are being under utilised; capital goods are not being productive and this can have an impact of productivity...
What is happening with the UK's output gap?

According to the above graph the output gap is actually improving. 2010 saw the output gap reaching 4% but from 2010 onwards we have seen the output gap fall to around 2.5%. Be careful when interpreting diagrams in the exam. Read the axis carefully.
No comments:
Post a Comment