Showing posts with label Output Gap. Show all posts
Showing posts with label Output Gap. Show all posts
Wednesday, 8 February 2017


Thursday, 7 April 2016
Unit 2 & 4: The Output Gap
What is the output gap?
The output gap is the difference between the actual level of GDP and its estimated potential level. It is usually expressed as a percentage of the level of potential output.

Negative and Positive Output Gaps
Negative Output Gap
- When the level of actual GDP is less than potential GDP
- Some factor resources are under-utilized e.g. demand-deficient unemployment
- Main problem is likely to be higher unemployment and possible deflation risk
Positive Output Gap
- Actual GDP is greater than the estimated potential GDP
- Some resources working beyond usual capacity (shift work & overtime)
- Main problem is rising demand-pull and cost-push inflationary pressures

What are the main difficulties in estimating the size of the output gap for an economy?
The output gap is a measure of the difference between the actual output of an economy and its potential output.
Estimating the output gap is difficult because we cannot observe directly the supply potential of an economy directly
Problems in estimating the output gap include:
- Inaccurate data on the labour force for example difficulties in measuring the scale of net inward labour migration
- Problems in accurately measuring productivity
- Surveys of producers about spare capacity may be inaccurate
- Gaps in knowledge about how much businesses are investing and the potential output from new capital e.g. in digital sectors
- Uncertainties about the number of people who may have left the labour market as “discouraged workers”
- It is hard to measure the amount of under-employment in the labour market at different stages of the economic cycle
Sunday, 5 May 2013
Unit 2: Output Gap
The output gap is the difference between the actual level of output and the potential level of output.
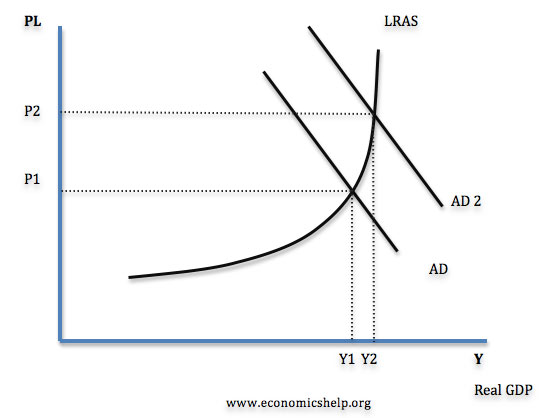
If you look at the above graph, the potential level of output is Y2. We know that this is full capacity as at Y2 the LRAS is inelastic indicating no spare resources.
In the above graph the actual level of output is Y1; We have a negative output gap! The output gap is the difference between potential and actual output (Y2-Y1)
What are the consequences of an output gap?
Well, firstly there is downward pressure on the price level as indicated by the fall from P2 to P1. This could potentially be a good thing as it could improve international competitiveness.
The second most obvious impact is a fall in employment as illustrated by the move from Y1 - Y2. More unemployment means that there is excess supply in the labour market and as a result workers have less bargaining power when it comes to wages and therefore have to accept lower wages.
A fall in output from Y1 - Y2 also means that other factors of production are being under utilised; capital goods are not being productive and this can have an impact of productivity...
What is happening with the UK's output gap?

According to the above graph the output gap is actually improving. 2010 saw the output gap reaching 4% but from 2010 onwards we have seen the output gap fall to around 2.5%. Be careful when interpreting diagrams in the exam. Read the axis carefully.
Subscribe to:
Posts (Atom)